web analytics

How to filter reports

Step 1: Open the corresponding built-in report:

  • Click on "Reports" on the Menu bar.
  • Then hover over "Settlement Reports".
  • Then click on "Potential Inquires (904)"

Step 2: Click on the "Show Report" button to view all "Potential clients"

Image

Step 1: Open the corresponding built-in report:

  • Click on "Reports" on the Menu bar.
  • Then hover over "Settlement Reports".
  • Then click on “Client Intake Summary – Individual (905)”.
Image

Step 2: Enter Search Parameters to get the Permanent Clients:

  • Enter the date range when the clients had first intake in the agency, in the “Starting Intake Date” and the “Ending Intake Date”. Please note that both fields are mandatory.
  • (Optional) Select Country of Origin
  • (Optional) The “Date Type” allows you to get all clients based on for example their intake date, date of arrival etc.
  • Click on the “Show Report” button.
Image

A table will then appear to show all Permanents Clients who were recorded during this timeframe.

Filtering a list of clients

To further narrow down your data as required from the list of clients that appear after clicking on the “Show Report” button:

  • Use the second row of the table below the header/title for each column.
  • Go to the second row for the column that you want to filter, then click on the dropdown arrow.
  • Select the criteria.
    Note the criteria will appear differently based on the data in the column. The filter option in CARMIS is designed similar to the filter option of Microsoft Excel.
  • Click on "OK"
Image

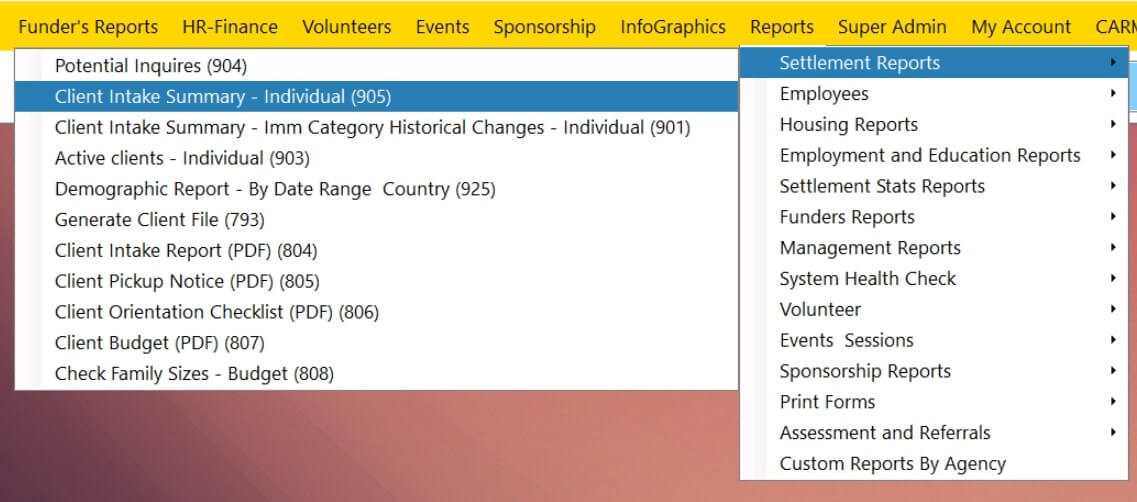
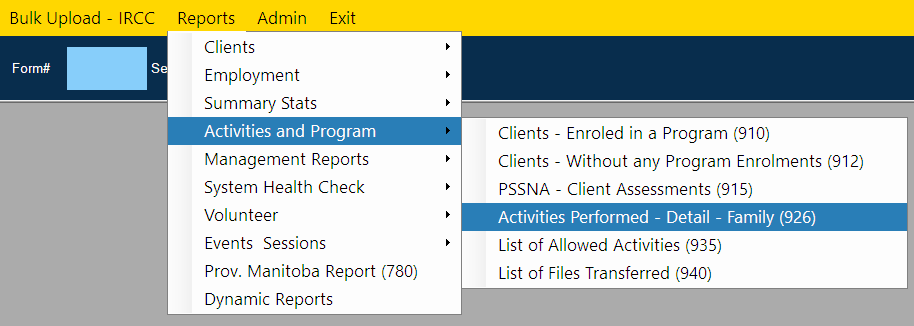
Step 1: To filter a report, first click on "Reports" from the Menu Bar and select the report form you would like to filter. For our example, we will be using the "Activities Performed - Detail - Family (926)" form.

Image

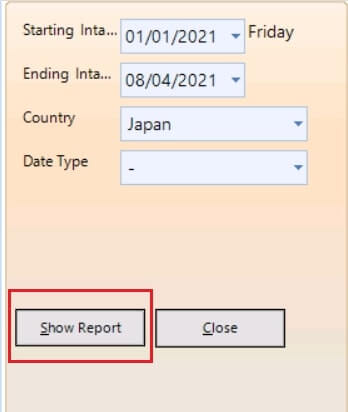
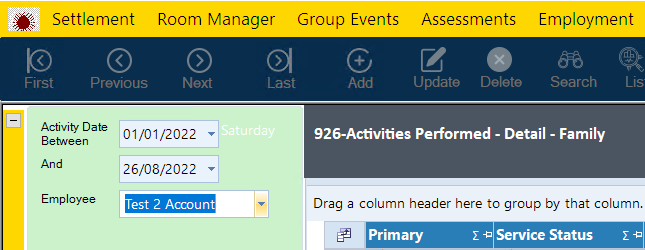
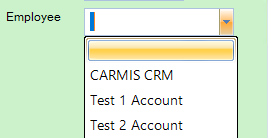
Step 2: You can now select which information you would like to show in your report. This can be done by choosing from the options on the left-side panel.

Image
(Note: The first blank dropdown item functions as a "show all" option)
Image

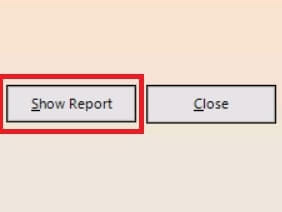
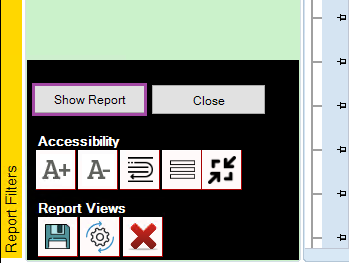
Step 3: Once you have set your report preferences, click on the "Show Report" button at the bottom left. This will show you a report based on your selections from step 2.

Image

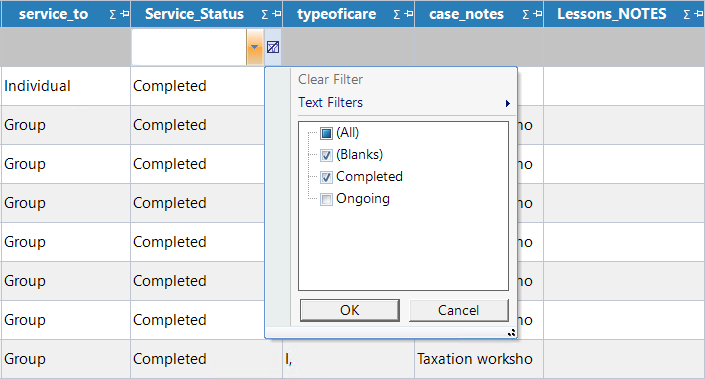
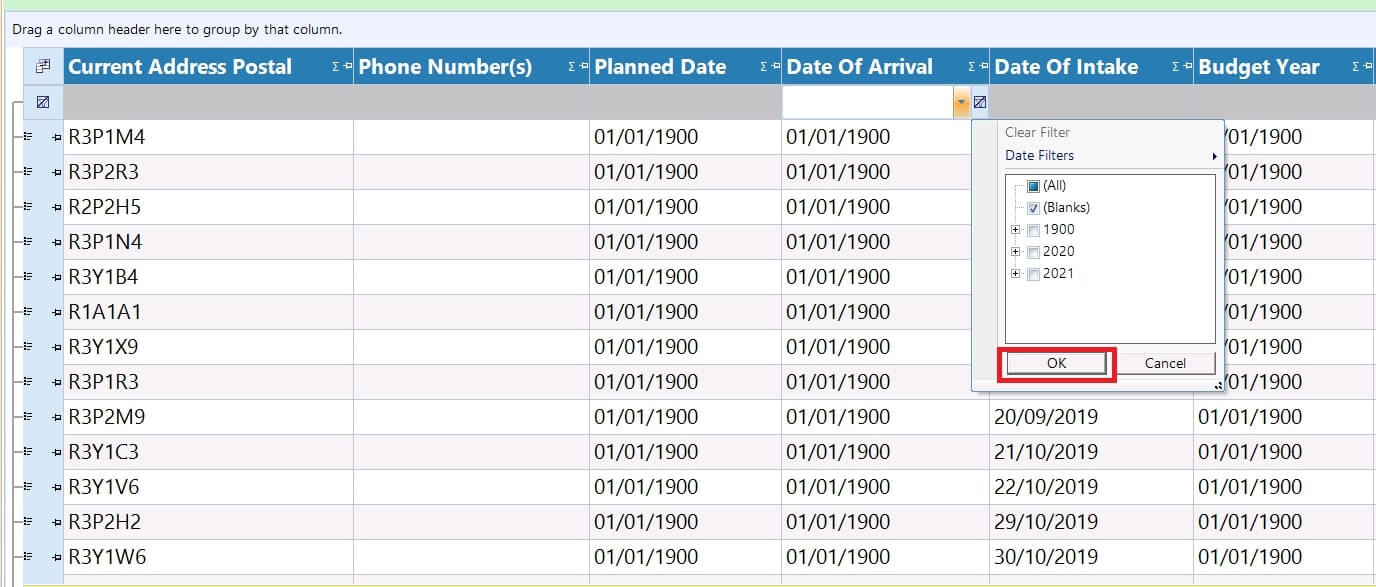
Step 4 (Optional): Your report will now appear. Optionally, you can add filters to your data:

  1. In the column you would like to filter by, click on the top blank cell.
  2. You can now either type criteria, or select criteria from the dropdown.
  3. Click OK. You will see the report change according to the criteria set.
  4. Repeat for any other fields you would like to filter.
Image
Was this article helpful?

Need Support?

Can't find the answer you're looking for?
Contact Support