
Accessibility Settings
Step 1: Open any report in CARMIS using the sidebar on the left side. Navigate to Reports and select your report. For this example we will be using report 'Online Intake Request/Inquiries (904)'. Once the report is open, run the report by clicking 'Show Report'.
Once the report loads, the top tool strip allows you to tweak and enhance the report to your needs.
- Clean View - Toggling this will make the report cleaner, will get rid of grid.
- Wrap - Allows text wrapping on the report.
- Field Chooser - Allows you to select more fields to show on the report.
- Load Layout - Load saved layouts for viewing.
- Conditional Coloring - Apply custom coloring to custom filtered data on the report. To learn more, please read our article:
- Save Layout - You can save the layout of this report, e.g If you have custom filters enable or have custom coloring enabled, you can save the layout for later use.
- Excel - Creates a downloadable Excel sheet of the report.
- PDF - Creates a downloadable PDF sheet of the report.
- Execution Time - See load times for the report.

Save Layout
Step 1: Once you have applied your custom filters and you want to save this layout, click 'Save Layout'.

Step 2: Once clicked a pop up window will appear, Enter the layout name.
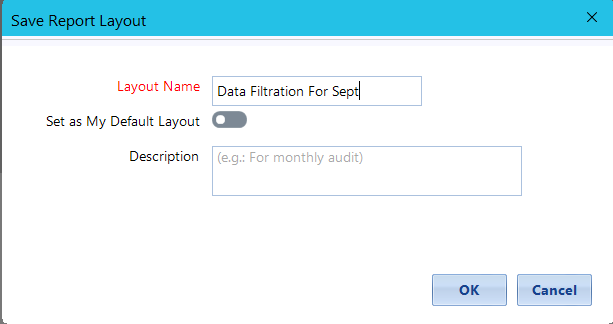
Step 3: If you want this layout to be the default view for when you open this report, toggle 'Set as My Default Layout'. You can enter a description for this layout.
Once you have made your configuration, click 'Ok' to save the layout.
Load Layout
Step 1: Click 'Load Layout' in the top tool strip of the report.

Step 2: Once clicked a pop up will appear, click on the green button to load your layout. Once clicked the pop up will close and your layout will show.

Deleting saved layouts
Step 1: Click 'Load Layout' in the top tool strip of the report.
Step 2: Once the pop up shows, click on the Red X icon to delete the layout:

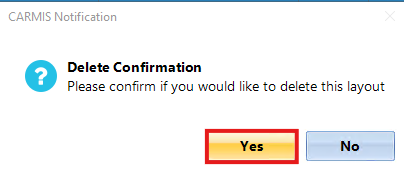
Step 3: A confirmation pop up will appear, click 'Yes' to confirm the deletion of layout.
Applying The Field Chooser
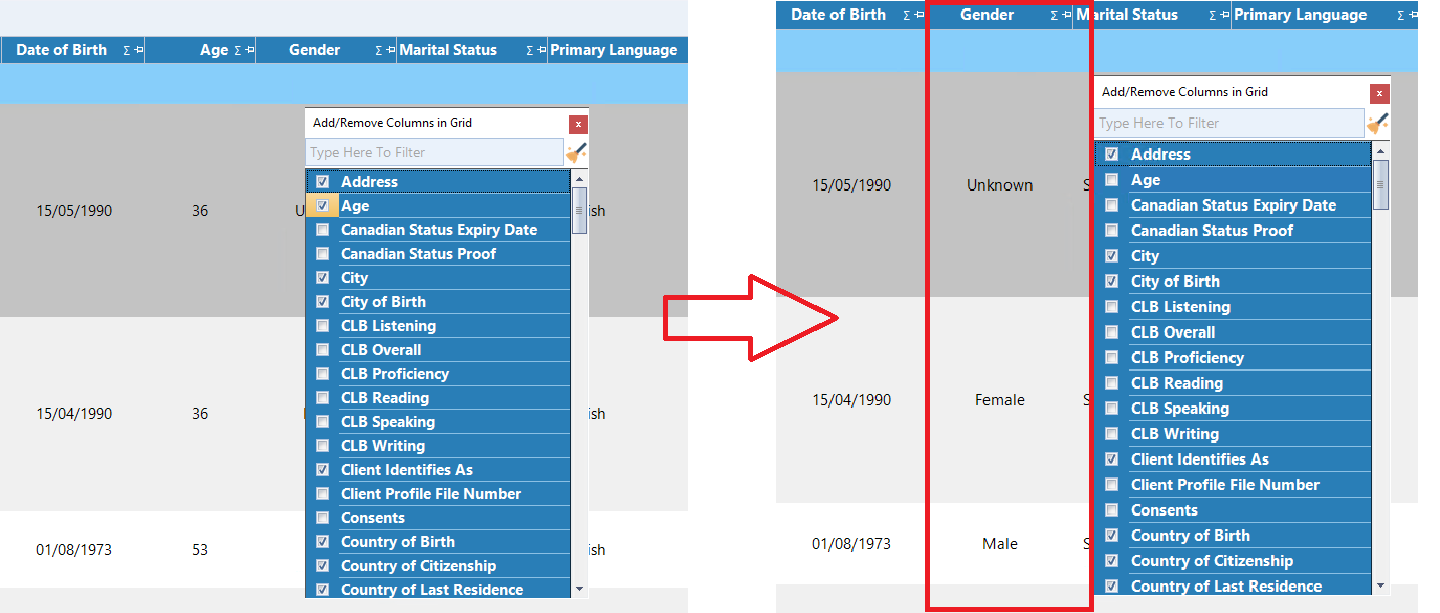
The Field Chooser allows you to hide (or unhide) columns from the report.
Step 1: Click 'Field Chooser' in the top tool strip of the report.

Step 2: Uncheck the columns you want to hide. The report will update right-away.
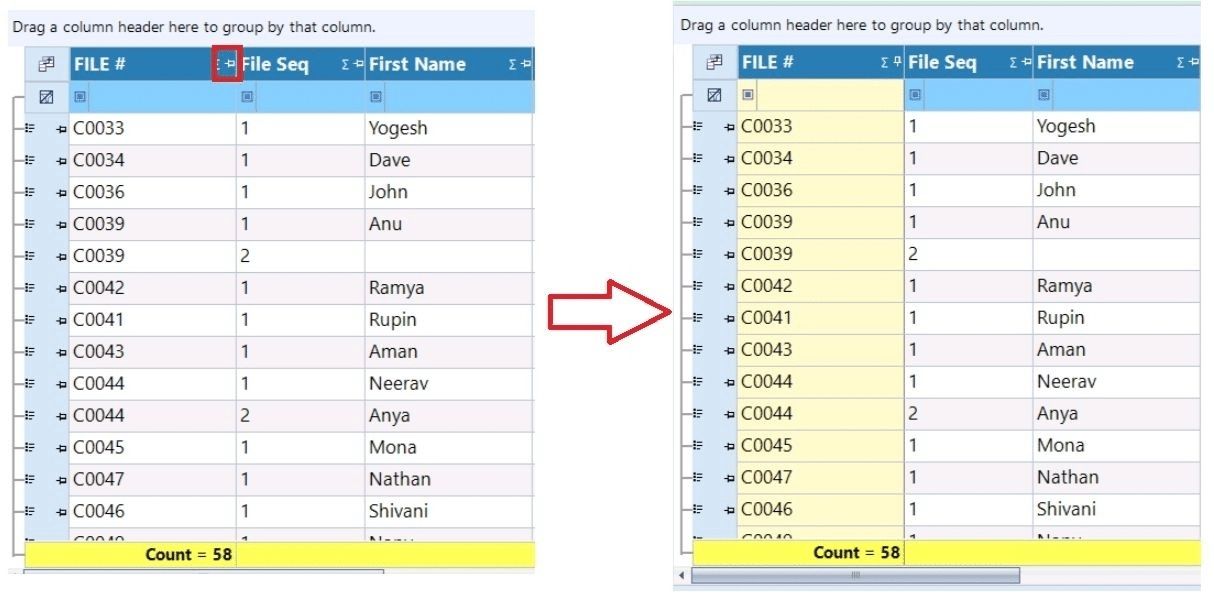
Pinning Rows/Columns
Pinning causes rows/columns to stay visible while scrolling, similar to column freezing in Microsoft Excel. Pinned rows/columns are displayed with a different colour than other rows, to indicate that they are pinned. To pin or unpin a row/column, simply click on the “pin” icon at the top or left.